Whole Athlete/Specialized Team Partners
with Quarq Powermeters for 2015
with Quarq Powermeters for 2015

Introducing, The Quarq Factor Project

By analyzing race data throughout the year, the team will determine optimal pacing strategies, measure power requirements of each course, and explore what it takes for each rider to continue on an optimal development path with greater training specificity.
Whole Athlete/Specialized will publish an analysis of the data periodically to demonstrate the power of the Quarq for competitive cyclists looking to take their racing to the next level.
The Quarq Factor Criteria
At Whole Athlete, we use a standard called Maximal Steady State (MSS), a real-world performance threshold of 20-30 minutes MSS power and heart rate reflect a readily measurable and repeatable criterion confirmed with either a simple field test or through the valid MSS testing protocol used at the Whole Athlete Performance Center.
During a mountain bike race, a better representation of the highly variable workload over time is normalized power since it represents the physiological demands by estimating the power that could have been maintained had it been constant. For each rider, normalized power as a percentage of their individual MSS gives the value relative meaning since each person's specific power levels can be quite different. We will keep each rider's actual power data confidential, yet still provide a representation that is meaningful and informative.
The Quarq Factor - Round One:
Bonelli Park ProXCT-US Cup #1
The opening round of the ProXCT-US Cup Series, Bonelli Park served as the first opportunity to gather and analyze race data. Under hot conditions and on a very punchy course with no sustained climbs or extended sections of recovery, proper pacing was the name of the game as was underscored by a strong correlation between first vs. last lap power and race outcome.
In the three-lap race, our Junior riders who were most successful employed a strategy of keeping their first lap normalized power close to 100% of their MSS. After a slightly lower paced second lap, they either matched their opening lap power in the final lap or increased it. The riders who started out too hard on their first lap at 115-118% of their MSS, were not able to maintain a similar level thereafter, showing a decrease of 10-12% in average power on their last lap (Table 1).
Table 1: Quarq Factor Power Analysis -
Bonelli Park ProXCT-US Cup #1
Junior Men and Women
Bonelli Park ProXCT-US Cup #1
Junior Men and Women
| Normalized Power as Percentage of MSS | ||||
| Lap 1 | Lap 2 | Lap 3 | Lap 3 vs. Lap 1 | |
| Athlete 1 | 102% | 93% | 104% | +2% |
| Athlete 2 | 118% | 101% | 109% | -10% |
| Athlete 3 | 100% | 91% | 101% | +1% |
| Athlete 4 | 100% | 92% | 101% | +1% |
| Athlete 5 | 115% | 102% | 103% | -12% |
In
the Elite Men's seven-lap UCI race, pacing became even more critical
given the heat and length of the event. After a fast first lap that
included an all out start loop, our U23 rider paced his efforts between
83-87% of MSS power for five laps, allowing him to raise his effort to
90% of MSS for the last lap, earning him additional places (Table 2). He
started from a 50th place call up and finished 21st. After the first
lap, his last lap was fastest.
Table 2: Quarq Factor Power Analysis -
Bonelli Park ProXCT-US Cup #1
Elite/ U23
Bonelli Park ProXCT-US Cup #1
Elite/ U23
| Normalized Power as Percentage of MSS | |||||||
| Entire Race | Lap 1* | Lap 2 | Lap 3 | Lap 4 | Lap 5 | Lap 6 | Lap 7 |
| 89% | 100% | 89% | 88% | 87% | 83% | 86% | 90% |
| *Lap 1 includes start loop. | |||||||
The Quarq Factor - Round Two:
Fontana ProXCT-US Cup #2 / Junior UCI
Round two of the ProXCT-US Cup and the first Junior UCI event at Fontana provided another opportunity to examine race data, this time on a course that featured significantly more sustained climbing (Diagram 1). Each lap was defined by a total of 650 feet of vertical gain over a distance of 3.5 miles, with nearly all the climbing coming in the first two miles. After a demanding, technical descent, the riders then faced approximately a mile of flat terrain before the road tilted back up again for the following lap. Junior men completed three laps, while the Junior Women did two. The Pro/ U23 field faced a slightly shorter version of the same course with close to 500 feet of vertical each time for a total of six laps (Diagram 2).
Diagram 1: Fontana ProXCT-US Cup #2
Junior Cat 1 Course Profile
Junior Cat 1 Course Profile

Diagram 2: Fontana ProXCT-US Cup #2
Elite/ U23 Course Profile (UCI HC)
Elite/ U23 Course Profile (UCI HC)

Once
again, pacing was the name of the game as the best performances from
our Juniors came as a result of keeping a well regulated effort on lap
1, allowing a high output on the final lap. The exception was Athlete 1
who followed an early attack by the Junior World Champion and rode with
him up the first climb, requiring a significant Lap 1 output (Table 3).
After a small technical mishap and losing contact with him at the top,
Athlete 1 then settled into his own pace for the final two laps and
paced it well, raising his output on Lap 3 to hold onto 2nd place.
Meanwhile, Athlete 2 paced himself perfectly to produce the same output
on Laps 1 and 3, actually riding the same Lap 3 time as Athlete 1. Athlete
3 started relatively hard and then had an unfortunate crash, which
affected his pacing thereafter. Meanwhile, all three of the Junior Women
paced their races well despite the shorter distance of their event
(Table 4).
Table 3: Quarq Factor Power Analysis -
Fontana ProXCT-US Cup #2 / Junior UCI
Junior Men
Fontana ProXCT-US Cup #2 / Junior UCI
Junior Men
| Normalized Power as Percentage of MSS | |||||
| Entire Race | Lap 1 | Lap 2 | Lap 3 | Lap 3 vs. Lap 1 | |
| Athlete 1 | 92% | 102% | 95% | 97% | -5% |
| Athlete 2 | 96% | 97% | 92% | 97% | 0% |
| Athlete 3 | 101% | 108% | 98% | 94% | -4% |
Table 4: Quarq Factor Power Analysis -
Fontana ProXCT-US Cup #2 / Junior UCI
Junior Women
Fontana ProXCT-US Cup #2 / Junior UCI
Junior Women
| Normalized Power as Percentage of MSS | ||||
| Entire Race | Lap 1 | Lap 2 | Lap 2 vs. Lap 1 | |
| Athlete 1 | 94% | 95% | 93% | -2% |
| Athlete 2 | 95% | 97% | 93% | -4% |
| Athlete 3 | 96% | 97% | 96% | -1% |
In
the Elite men's race, our U23 rider was hindered at the start by riders
crashing in front of him, requiring a bigger effort to regain
positioning throughout the first two laps. Thereafter, he paced it well
for the remaining four laps with only a slight drop in power midway
through Lap 3, yet finishing with a very consistent second half to his
race (Table 5). His steady output gained him over 30 places after the
start mishap amid a field of 106 riders in the highest level UCI HC
event.
Table 5: Quarq Factor Power Analysis -
Fontana ProXCT-US Cup #2
Elite/ U23
Fontana ProXCT-US Cup #2
Elite/ U23
| Normalized Power as Percentage of MSS | ||||||
| Entire Race | Lap 1 | Lap 2 | Lap 3 | Lap 4 | Lap 5 | Lap 6 |
| 92% | 99% | 93% | 87% | 89% | 91% | 89% |
The Quarq Factor Rounds 1 and 2 - Conclusions
In comparing our Junior athletes' data between the two races, the fact that Bonelli lacked the sustained climbing and steady flat section of Fontana governed the kind of power that was produced. Since all the climbing at Bonelli was relatively steep and of short duration, normalized power was generally higher across the laps. Bonelli also had more opportunities for recovery since the descending was straightforward and distributed throughout the course, whereas the highly technical, more sustained Fontana descent demanded a high degree of focus and effort. The Fontana course also required longer segments of sustained power, resulting in a greater challenge to match or increase last lap average power.
It is interesting to note how the weather conditions and race duration affected both pacing and average power for the Elite/ U23 race. The Elite race was held during the hottest part of the day at both events and the duration was 10-20 minutes longer than the Junior Men's 17/18 races. These factors placed an even greater premium on intelligent pacing strategy and avoiding going out too hard on the early laps. Our U23 rider was admittedly more efficient with his output at Bonelli than at Fontana, in part due to the mishap at the start line of the Fontana race. His first two laps there showed the higher effort required to move through traffic, and once he settled in the power was similar between the two races for the remaining laps. As compared with the Juniors, our U23 rider sustained more power on flat sections at Fontana, increasing his lap power averages to be more on par with those of Bonelli.
One other factor to consider is how crashes and technical mishaps affect pacing. At Fontana, many riders were challenged with the highly technical nature of the course and a few of our riders had falls - fortunately with minimal physical effect. Nonetheless, these mishaps certainly affect pacing and momentum in a race. In the Junior Men, Athletes 1 and 3 (Table 3) both experienced this challenge, which affected their power and the outcome of their respective races.
Next on tap for the Quarq Factor Project are the ProXCT-US Cups at Bonelli #2 and Sea Otter Classic in mid-April, when we will once again have the opportunity to compare race data from two very different courses. Stay tuned for more interesting power data and analysis!

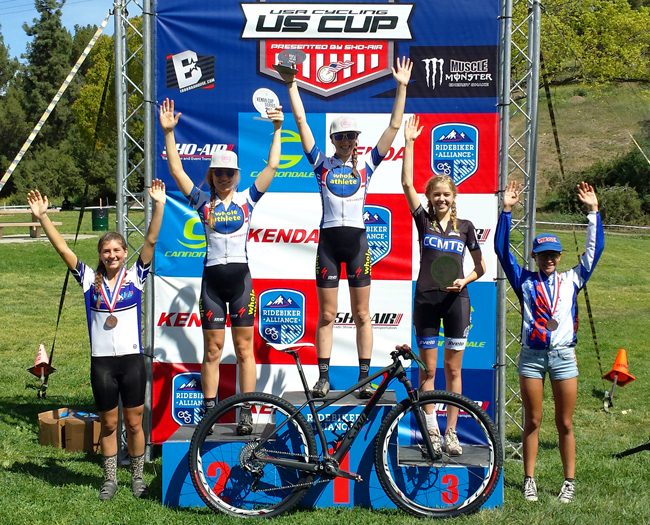
Bonelli Park ProXCT-US Cup #1 Cat 1 Women's podium.

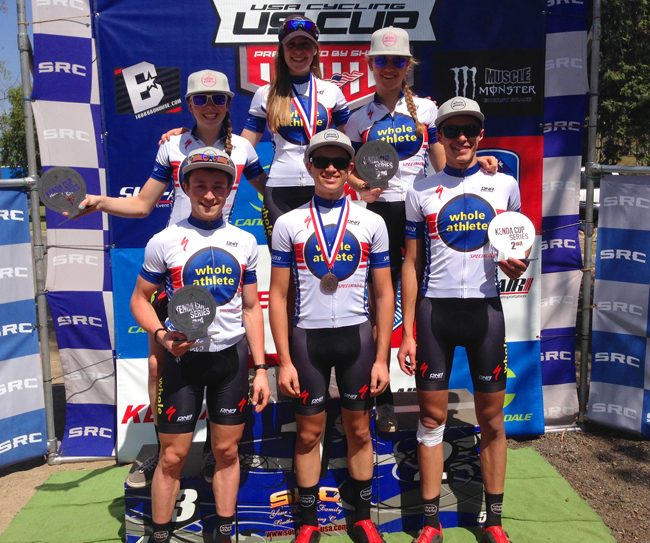
Team podium finishers at Fontana ProXCT-US Cup #2.

No comments:
Post a Comment