

Phase Three - The Elevation Effect
After the brief and illuminating foray into European Spring racing, for Phase Three of the Quarq Factor the remaining three US summer races provided an opportunity to examine the effects of moderate to very high elevation across three UCI Junior events: the Missoula ProXCT, Colorado Springs ProXCT, and the National Championships at Mammoth Mountain, CA.
The Quarq Factor Criteria
At Whole Athlete, we use a standard called Maximal Steady State (MSS), a real-world performance threshold of 20-30 minute peak power and heart rate which reflect readily measurable and repeatable criteria confirmed with either a simple field test or through the validated MSS testing protocol used at the Whole Athlete Performance Center.
During a mountain bike race, a better representation of the highly variable workload over time is normalized power since it represents the physiological demands by estimating the power that could have been maintained had it been constant. For each rider, normalized power as a percentage of their individual MSS gives the value relative meaning since each person's specific power levels can be quite different. We will keep each rider's actual power data confidential, yet still provide a representation that is meaningful and informative.
The Elevation Effect
With three domestic UCI events on tap for the Juniors, culminating with the very high elevation National Championship race at Mammoth Mountain, the Whole Athlete/Specialized Team embarked on a four-week high elevation acclimation race camp to prepare the riders for the hypoxic demands of racing above 8000 ft. The first stop was the Missoula ProXCT where the course climbs up to moderate elevation at just under 4500 ft., followed by the Colorado Springs ProXCT at a high elevation of 6500 ft., and finally Nationals in Mammoth on a course that topped out at the very high elevation of 8800 ft.
Many sea level riders experience adverse effects even at the moderate elevation of the Missoula ProXCT course. Given the pure climbing nature in which almost all the elevation gain occurs in the first 3/4 of each lap, pacing is critical. The race starts immediately up the main climb with little to no recovery until the highest point. Despite the successful outcome of the race for our riders, a few fell victim to an unsustainable initial output (Table 1). Athlete 3 and Athlete 4 both suffered later in the race from their first lap efforts, with Athlete 4 fading significantly from such a hard starting lap at 115% of MSS. Only those who are from high elevation were able to bounce back from the fast start, and those that rode the first lap at or below their MSS normalized power performed the best.
At the high elevation of Colorado Springs, the athletes from elevation performed best, as those from sea level were still in the acclimation process. Yet despite not being fully acclimated, all of the non-elevation athletes paced it well and thus performed well (Table 2). The punchy nature of the course resulted in lower average power for most of the riders as compared with Missoula.
The main target - XC National Championships in Mammoth - posed a major challenge to those not fully acclimated to high elevation. With a course that climbed from 8000 to 8800 feet of elevation each lap, the thin, dry air was sure to be a factor. Even those who live at relatively high elevation are challenged to avoid the common pitfall of starting too hard at such altitude where it can be impossible to recover from going too deep early on. With this important strategy in mind, most of our athletes kept their initial lap under control, and those that did performed well. The exceptions were Athlete 3 who struggled to come back after an early crash, and Athlete 4 who started harder than sustainable at such high elevation, fading significantly in the last two laps (Table 3). Once again, the ability to start hard enough without going too deep, maintain steady pacing for the middle laps, and finish with a strong final lap resulted in the best performances.
Table 1: Missoula, MT ProXCT - Junior UCI
Normalized Power as Percentage of Maximal Steady State
Normalized Power as Percentage of Maximal Steady State
| Lap 1 | Lap 2 | Lap 3 | Lap 4 | Lap 5 | Lap 6 | Race Avg | |
| Athlete 1 | 100% | 89% | 91% | 89% | 93% | ||
| Athlete 2 | 105% | 94% | 91% | 97% | 97% | ||
| Athlete 3 | 108% | 90% | 90% | 96% | 97% | ||
| Athlete 4 | 115% | 103% | 95% | 78% | 100% | ||
| Athlete 5 | 91% | 86% | 88% | 85% | 84% | 88% | 87% |
Table 2: Colorado Springs, CO ProXCT - Junior UCI
Normalized Power as Percentage of Maximal Steady State
Normalized Power as Percentage of Maximal Steady State
| Lap 1 | Lap 2 | Lap 3 | Lap 4 | Lap 5 | Lap 6 | Lap 7 | Race Avg | |
| Athlete 1 | 77% | 80% | 76% | 79% | 83% | 80% | ||
| Athlete 2 | 100% | 97% | 99% | 101% | 108% | 102% | ||
| Athlete 3 | 105% | 106% | 100% | 102% | 114% | 106% | ||
| Athlete 4 | 99% | 85% | 86% | 90% | 91% | |||
| Athlete 5 | 77% | 80% | 76% | 77% | 79% | 79% | 88% | 80% |
| Athlete 6 | 88% | 82% | 86% | 92% | 88% | |||
| Athlete 7 | 87% | 81% | 80% | 86% | 84% | |||
| *Final lap for each was a half lap. | ||||||||
Table 3: XC National Championships, Mammoth Mountain, CA
Normalized Power as Percentage of Maximal Steady State
Normalized Power as Percentage of Maximal Steady State
| Lap 1 | Lap 2 | Lap 3 | Lap 4 | Lap 5 | Race Avg | |
| Athlete 1 | 83% | 85% | 84% | 86% | 85% | |
| Athlete 2 | 102% | 99% | 97% | 96% | 99% | |
| Athlete 3 | 101% | 87% | 80% | 78% | 88% | |
| Athlete 4 | 108% | 95% | 86% | 76% | 93% | |
| Athlete 5 | 83% | 80% | 78% | 80% | 87% | 82% |
| Athlete 6 | 92% | 84% | 87% | 88% | ||
| Athlete 7 | 88% | 82% | 78% | 83% |
Table 4: Time at Maximal Steady State (MSS) and Supra-Threshold Power by Event
| MSS: | 100 - 120% | 120-140% | >140% | ||||||
| Event: | Missoula | Co Springs | XC Nats | Missoula | Co Springs | XC Nats | Missoula | Co Springs | XC Nats |
| Athlete 1 | 9:05 | 7:08 | 8:38 | 11:00 | 9:15 | 10:15 | 7:40 | 4:30 | 2:45 |
| Athlete 2 | 7:00 | 4:30 | 6:39 | 12:00 | 11:33 | 12:00 | 14:00 | 18:00 | 15:00 |
| Athlete 3 | 8:48 | 7:15 | 8:40 | 11:30 | 16:00 | 9:10 | 6:00 | 12:20 | 3:45 |
| Athlete 4 | 15:15 | 13:30 | 12:30 | 11:10 | 6:36 | 7:00 | 6:20 | 3:30 | 4:00 |
| Athlete 5 | 12:00 | 11:51 | 10:00 | 14:15 | 12:15 | 9:15 | 7:45 | 7:15 | 4:15 |
| Athlete 6 | 13:07 | 9:04 | 5:54 | 5:23 | 4:20 | 3:00 | |||
| Athlete 7 | 10:41 | 9:09 | 5:15 | 4:14 | 6:30 | 3:15 | |||
Table
4 shows time at MSS power and above by event. Consistent with data
from the spring races, the course profiles once again influence power
distribution. Courses with more sustained climbing such as Missoula and
Nationals tend to have less time spent at the highest power range,
whereas the punchiness of a course like Co Springs results in more time
>140% of MSS. It is interesting to note that individual differences
between athletes show up in their time at various power ranges, which
underscores where each athlete naturally excels. For example, Athlete 2
and Athlete 3 have excellent relative supra-threshold power. Athlete 1
and Athlete 5 also have good supra-threshold power, yet also show more
depth of sustainable power and the ability to maintain a high "floor" of
MSS to 140% of MSS power, even on punchier courses. Tables 5-11 below
further demonstrate the individual differences when looking at each
athlete's power separately.
Table 5: Comparison of US Summer Events - Athlete 1
Time at Maximal Steady State (MSS) and Supra-Threshold Power
Time at Maximal Steady State (MSS) and Supra-Threshold Power
| MSS: | 100 - 120% | 120-140% | >140% | Climbing |
| Missoula | 9:05 | 11:00 | 7:40 | Sustained |
| Co Springs | 7:08 | 9:15 | 4:30 | Short/ Punchy |
| Nationals | 8:38 | 10:15 | 2:45 | Sustained |
Table 6: Comparison of US Summer Events - Athlete 2
Time at Maximal Steady State (MSS) and Supra-Threshold Power
Time at Maximal Steady State (MSS) and Supra-Threshold Power
| MSS: | 100 - 120% | 120-140% | >140% | Climbing |
| Missoula | 7:00 | 12:00 | 14:00 | Sustained |
| Co Springs | 4:30 | 11:33 | 18:00 | Short/ Punchy |
| Nationals | 6:39 | 12:00 | 15:00 | Sustained |
Table 7: Comparison of US Summer Events - Athlete 3
Time at Maximal Steady State (MSS) and Supra-Threshold Power
Time at Maximal Steady State (MSS) and Supra-Threshold Power
| MSS: | 100 - 120% | 120-140% | >140% | Climbing |
| Missoula | 8:48 | 11:00 | 6:00 | Sustained |
| Co Springs | 7:15 | 16:00 | 12:20 | Short/ Punchy |
| Nationals | 8:40 | 9:10 | 3:45 | Sustained |
Table 8: Comparison of US Summer Events - Athlete 4
Time at Maximal Steady State (MSS) and Supra-Threshold Power
Time at Maximal Steady State (MSS) and Supra-Threshold Power
| MSS: | 100 - 120% | 120-140% | >140% | Climbing |
| Missoula | 15:15 | 11:10 | 6:20 | Sustained |
| Co Springs | 13:30 | 6:36 | 3:30 | Short/ Punchy |
| Nationals | 12:30 | 7:00 | 4:00 | Sustained |
Table 9: Comparison of US Summer Events - Athlete 5
Time at Maximal Steady State (MSS) and Supra-Threshold Power
Time at Maximal Steady State (MSS) and Supra-Threshold Power
| MSS: | 100 - 120% | 120-140% | >140% | Climbing |
| Missoula | 12:00 | 14:15 | 7:45 | Sustained |
| Co Springs | 11:51 | 12:15 | 7:15 | Short/ Punchy |
| Nationals | 10:00 | 9:15 | 4:15 | Sustained |
Table 10: Comparison of US Summer Events - Athlete 6
Time at Maximal Steady State (MSS) and Supra-Threshold Power
Time at Maximal Steady State (MSS) and Supra-Threshold Power
| MSS: | 100 - 120% | 120-140% | >140% | Climbing |
| Co Springs | 13:07 | 5:54 | 4:20 | Short/ Punchy |
| Nationals | 9:04 | 5:23 | 3:00 | Sustained |
Table 11: Comparison of US Summer Events - Athlete 7
Time at Maximal Steady State (MSS) and Supra-Threshold Power
Time at Maximal Steady State (MSS) and Supra-Threshold Power
| MSS: | 100 - 120% | 120-140% | >140% | Climbing |
| Co Springs | 10:41 | 5:15 | 6:30 | Short/ Punchy |
| Nationals | 9:09 | 4:14 | 3:15 | Sustained |
Season Summary - What have we learned?
The nature of cross country mountain bike racing, specifically at the international level has evolved into a shorter and more intense event than ever. Most UCI courses tend to favor those able to produce significant and repeated supra-threshold power, but also with a high sustainable power floor to back it up. The ability to start hard and produce a very high output without going too deep, recover well, and follow it up with strong pacing to finish without fading tends to result in the most successful performances.
While the unsustainable nature of the start of XC races is typical, the ability to regulate the initial output and ride within oneself is critical. There are many who are able to start fast, and even ride a very fast first lap. But without the depth and proper pacing to back up the initial lap, battling the inevitable fade throughout a race can be a losing struggle. Thus the dilemma we face in the need to start hard enough to be competitive, recover, and maintain a high output throughout. In US racing, there tends to be more opportunity to start a bit more conservatively, build throughout a race, and still perform well, while in Europe the level of competition and unyielding pace demands a fast start and the depth to back it up. With comprehensive power data now available thanks to the Quarq XX1 powermeter, we can see exactly what needs to happen to be successful at the highest level.
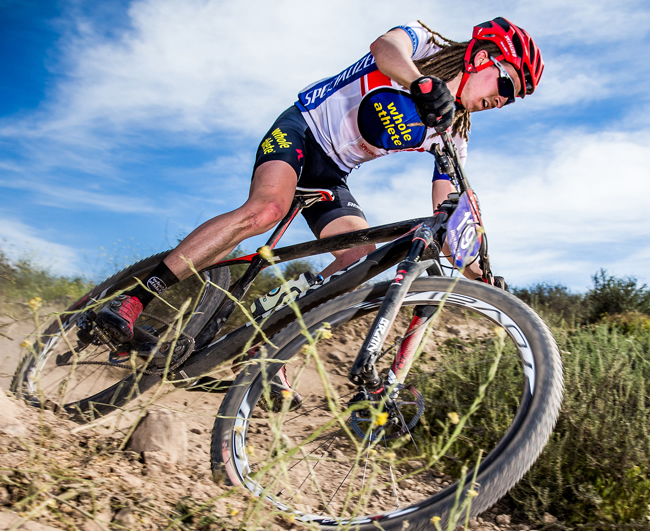
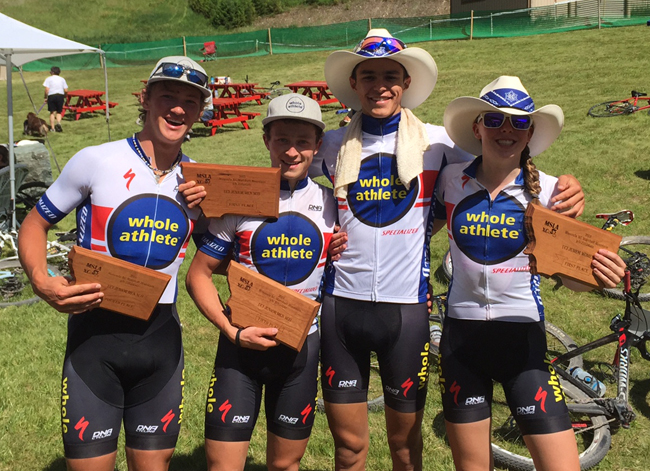
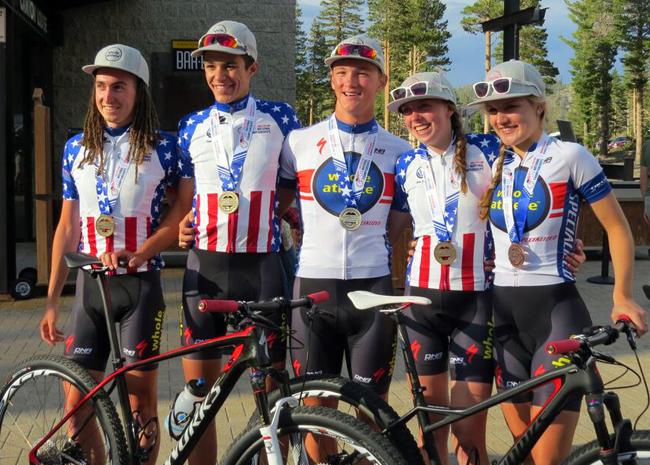
Gorry showed his consistency all season.
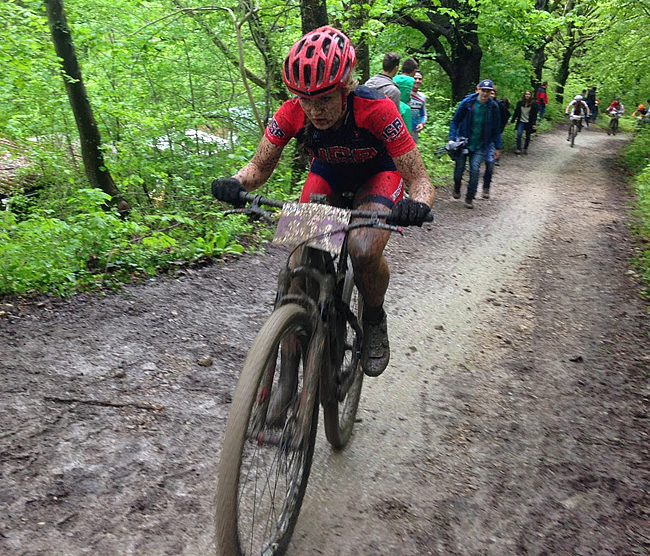
Urban battles in Euro mud.
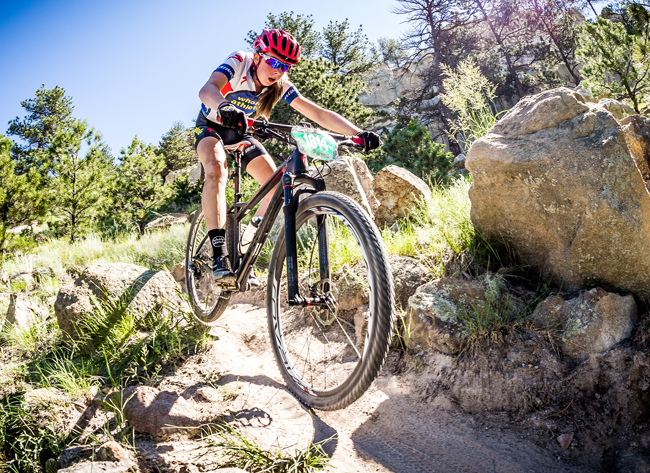
Batten excelled at high elevation.
About the Quarq Factor Project

By analyzing race data throughout the year, the team will determine optimal pacing strategies, measure power requirements of each course, and explore what it takes for each rider to continue on an optimal development path with greater training specificity.
Whole Athlete/Specialized will publish an analysis of the data periodically to demonstrate the power of the Quarq for competitive cyclists looking to take their racing to the next level.
About the Whole Athlete / Specialized Team
A non-profit Junior / U23 development program, the Whole Athlete/Specialized Team's mission is to invest in the future
of our youth and the sport of cycling by developing young athletes at the regional, national, and international levels with dedication, integrity, and fun. Our mission is enabled by
coaches, mentors, volunteers, and donors of the Velo Development Foundation,
a 501(c)(3) charitable organization.
The 2015 Whole Athlete / Specialized Cycling Team is a program of the the Velo Development Foundation, generously supported by Whole Athlete, Specialized Bicycle Components, Quarq Powermeters, Marin Natural Medicine Clinic, Marin Cyclists, DNA Cycling, Osmo Nutrition, ProBar, Oakley, Tam Bikes, KewlFit, Rock Tape, Elemental Herbs, DZ Nuts, ProGold Lubricants, Enduro Bearings, Feedback Sports, Play Hard Give Back, ESI Grips, Mellow Motors, Genuine Innovations, and Bungalow Munch Organic Granola.
The 2015 Whole Athlete / Specialized Cycling Team is a program of the the Velo Development Foundation, generously supported by Whole Athlete, Specialized Bicycle Components, Quarq Powermeters, Marin Natural Medicine Clinic, Marin Cyclists, DNA Cycling, Osmo Nutrition, ProBar, Oakley, Tam Bikes, KewlFit, Rock Tape, Elemental Herbs, DZ Nuts, ProGold Lubricants, Enduro Bearings, Feedback Sports, Play Hard Give Back, ESI Grips, Mellow Motors, Genuine Innovations, and Bungalow Munch Organic Granola.
©
2015 Whole Athlete / Specialized Team | www.wholeathlete.com/team


No comments:
Post a Comment